Conscious Investor makes it easy to
perform in-depth analysis on companies. Below we give a
few examples of some of the ways that this is done.
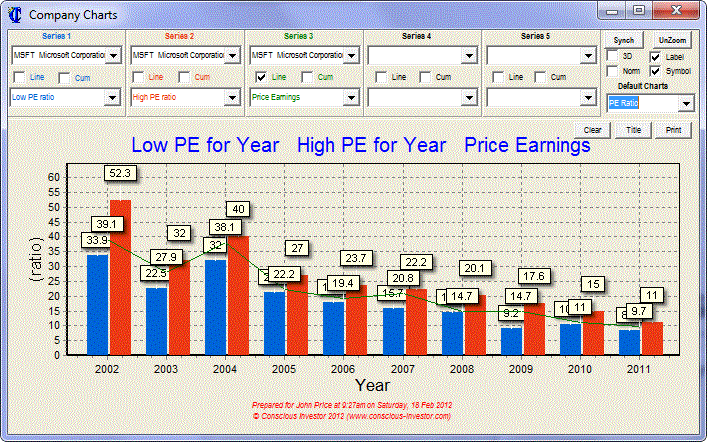
The Chart below shows the High
Price Earnings (PE) Ratio, the Low PE Ratio and the Current PE
Ratio for Microsoft Corporation (MSFT). By charting
the historic High, Low and Current Price Earnings Ratios
together we get a quick visual understanding of the price
trading range for a stock. We can determine
at a glance whether or not the Current Price Earnings Ratio
is relatively high or low for any stock.
Similarly, you can chart the
Price Earnings Ratios of any stock in relation to all
of the other companies within its Industry (for the Current
or past years). This allows you to see at a glance how
any stock compares with its peers.
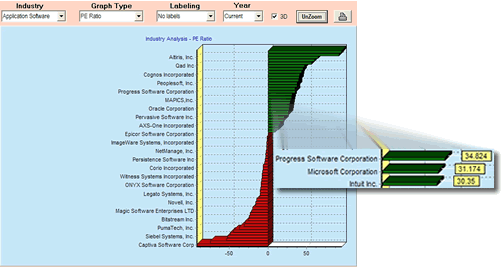
The above graphic below is not to scale. The actual
chart is much bigger. For illustration purposes, we
have "zoomed in" on the chart to show you
Microsoft's Price Earnings Ratio in relation to the
rest of the stocks within its Industry.
Once you have analyses
and selected a stock of interest, you then need to establish
a Target Purchase Price in order to achieve your minimum
required rate of return (eg 15% per annum). You do this
using the "What If Analysis" tools within Conscious
Investor. You can then enter your purchase (or sale) parameters
into the Conscious Investor Watch List. You may enter
a target Price Earnings Ratio or other measures other
than price as well.
Every time you update your
copy of Conscious Investor, the Watch List box will activate
if any of your pre-set triggers have been met.
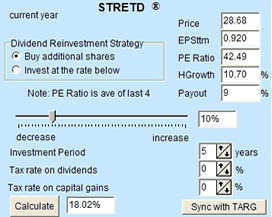
The STRET
box shows a default calculation for Stock Return
(or total return). This box shows us that if we purchased
Microsoft at the current prices - then $28.68 - assuming
without making any adjustments to historic data (which
we would normally do in order to reflect a higher "margin
of safety") then we could expect to achieve
an annual return of 18.2% per annum (including dividends
and capital growth) over the next five years.
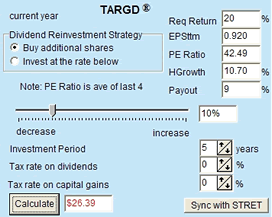
The second box shows TARG
which is our Target Purchase (or Selling)
Price. You can see that we've set our
minimum return at 20% per annum. This means that
we would need to purchase this stock at $26.39 to achieve
our minimum return requirements.
For an introduction to some
of the unique tools within Conscious Investor, click
here.
|
