This article describes research on a new test
that is included in the Conscious Investor Investment System.
The result is that we can provide earnings forecasts on
selected stocks that are five times more accurate than the
average of analysts' forecasts.
In the long run, the value of a stock is the
discounted value of the cash that can be taken out of the
company during its remaining life. The usual analysis requires
two inputs. Firstly, a forecast of how much cash the company
is going to generate year by year. This is generally written
as a percentage growth rate starting with the current cash.
Secondly, a rate at which this cash should be discounted.
There are two extra ingredients that are often
pushed to the background. The first is what do we mean by
the cash that can be taken out of the company. The simple
answer is the earnings. A better answer is one of the variations
of free cash flow. I’ll talk about this in a later
article. To keep things straightforward, here I will just
use earnings.
The second extra ingredient is confidence.
How confident are we with the earnings forecasts? I have
seen investors' eyes glaze over as they started imagining
the yacht they were going to buy. They had found a stock
and forecast its earnings to grow at 30% per annum. The
market had missed it and now our starry-eyed investors were
ready to make a killing. Alas, even though this was the
forecast, what are the odds of it being accurate?
First, lets consider how well the professional
do. In 1997 Lawrence Brown published a study in the Financial
Analysts Journal looking at 130,000 forecasts by analysts
from 1985 to 1996. He found that the average absolute error
was a whopping 91.6 percent.
The difficulty is that analysts are starting
behind the eight ball. They are assigned a group of companies
and told to forecast their earnings. Unfortunately the earnings
of companies such as Chiquita Brands and the Venator Group
have more ups and downs and twists and turns than The Beast
roller coaster in Cincinnati.
But we do not have this problem. No one tells
us which companies to analyze. We have 10,000 companies
to choose from so why not turn the problem around and focus
on those companies about which we can have confidence?
One way to do this is to eyeball the historical
earnings of companies and pick out those companies with
earnings that grew smoothly. Next, extrapolate the data
for these companies to forecast future earnings. This works
to some extent, but I wanted to automate the selection/forecasting
process.
This is where STAEGR™ enters, a new test
I developed for my investment software Conscious Investor.
It measures the stability of earnings growth from year to
year and expresses it as a percentage. The maximum figure
of 100% represents earnings that go up, or down, by the
same percentage each year. The calculations are based on
fitting an exponential curve to the historical data with
more emphasis on the stability of the growth of recent earnings.
Special adjustments are made for negative earnings, for
extreme outliers, and for earnings near zero.
Using Value Line data, I considered all the
companies with eleven years of earnings data from 1988 to
1998 inclusive. Next I divided the companies into ten groups
ranging from those with the highest STAEGR over the ten
years from 1988 to 1997 to those with the lowest STAEGR
over this period. Each group contained 115 companies.
The next step was to calculate the earnings
growth over the ten-year period using another Conscious
Investor function. Earnings in 1998 were forecast using
1997 data and this historical growth figure. Finally the
forecasted earnings were compared with the actual earnings
in 1998.
The result of most interest to
us was that the forecasted earnings of the high STAEGR group
were extremely accurate. For the technically minded, the
forecasted earnings explained 98 percent of the variation
of the actual earnings. This can be seen in the accompanying
chart.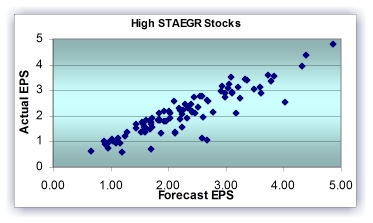
The points represent the earnings figures,
forecast and actual, of the companies in the group. Most
of the points lie on or near a straight line which means
that actual earnings were very close to the forecasts using
historical earnings. The STAEGR of this group of 115 companies
was 93% and up.
Another way of describing the results is that
the average absolute error for this group of was 16 percent
compared to the analyst error of 91.6 percent for all stocks.
The difference is even more significant than it appears
since the forecasts for the STAEGR method were for a full
year whereas those of the analysts were only for the next
quarter.
The results for the second group of stocks
was similar. Their STAEGR ranged from 90% to 93%. This means
that when we focus on stocks with the highest levels of
STAEGR, say 90% and up, then the past growth or earnings
is a statistically reliable predictor of earnings for the
following year.
The accompanying chart shows the data for
group of stocks with the lowest STAEGR. 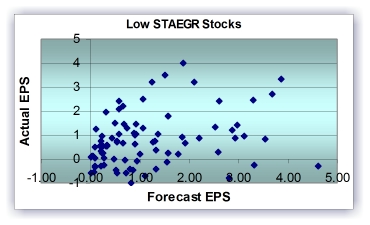
In contrast, to the previous chart, clearly
the dispersion of the data points is much higher. Notice
that for some of the points the forecast is negative while
the actual earnings are positive and for other points the
opposite holds, positive forecasts resulting in negative
outcomes.
The way these points are scattered is typical
of the groups of stocks with lower STAEGR. In each case,
the accuracy of the predictions using historical data was
lower in two ways. Firstly the data points were more dispersed.
Secondly the line of best fit had slopes further away from
1 and in many cases it was negative.
The study shows that you can have more confidence
that earnings will continue to grow as in the past for stocks
with a high level of STAEGR.
Of course, just because we have confidence
in our forecasts of future earnings of a company does not
mean that we should rush out and buy it. But it does provide
a solid basis for any buy/sell/hold analysis. Sorting stocks
with the high levels of STAEGR for earnings as well as sales
is another of the unique features of Conscious
investor.
|