|
 Following the investment advice
of your stock broker—or your neighbour—can take
you only so far. In the end most people want to delve deeper
into understanding any stocks that they are considering.
Following the investment advice
of your stock broker—or your neighbour—can take
you only so far. In the end most people want to delve deeper
into understanding any stocks that they are considering.
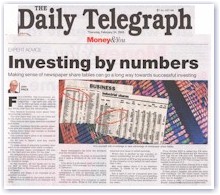
This requires knowing more about their “accounting
numbers”. The first place that you can see these are
in the share columns of newspapers. They come in two types,
absolute numbers and ratios. Absolute numbers describe specific
quantities and are usually in dollars and cents. Ratios
occur when one number is divided by another number.
The current share price is an example of an
absolute numbers. On its own it doesn’t give any useful
information. To make sense of absolute numbers, they need
to be compared with other numbers.
For example, many newspapers will also list
the high and low price for the year. By comparing the current
price with these prices we can tell whether a share is trading
at the top, in the middle, or at the bottom of its 12-month
range. At the moment, all the banks are in the top half
of their 12-month price ranges whereas Harvey Norman is
in the bottom of this range.
Dividend per share is an example of an absolute
number. When it is divided by the share price it is called
dividend yield and is an example of a ratio. Some newspapers
list both the dividend and the dividend yield. Consider
Telstra. Its price is around $5.30 and it paid a dividend
of 33 cents over the past year. This gives it a dividend
yield of 0.33/ 5.30 = 6.2 percent. (The average for the
market is 3.7 percent.)
A further pair of numbers listed in many newspapers
is that of earnings per share (EPS) and the Price-to-Earnings
ratio (PE ratio). The total income of a company is called
revenue or sales. What is left after paying expenses and
taxes is called earnings. When this is divided by the number
of shares outstanding, we are left with EPS. I like to think
of EPS as the money earned by the company on my behalf for
each share that I own.
But once again, since it is an absolute number,
it needs to be compared with some thing. For a start it
can be compared with the EPS for previous years. If you
are intending to invest in a company, one thing to look
for is how much the EPS has been growing over the years.
Price divided EPS is called the PE ratio.
Examples of low PE ratios are A.V. Jennings and Tap Oil
at 5.06 and 5.57. Examples of high PE ratios are Spotless
and Computer Share at 44.99 and 47.97. The average for the
market is around 17.3.
When people purchase shares with a high PE
ratio they are doing so on the belief that the earnings
are going to rise rapidly. If that doesn’t happen,
the price can drop very suddenly. On the other hand, shares
with a low PE ratio may not grow as fast but they can be
steadier.
John Price is CEO of Conscious Investing.
Email: johnprice@conscious-investor.com
|